Game Dev Articles
Sep 7, 2026 · 9 min read · DMG Forge
Unity Dev Tools Integration Guide: Connect Your Workflow Without Breaking Your Pipeline
Why Your Dev Tools Aren't Talking to Unity Yet If you're pulling in a profiler, a version control client, or a custom asset validator and it's sitting next to Unity instead of inside it, you're doing double work every...
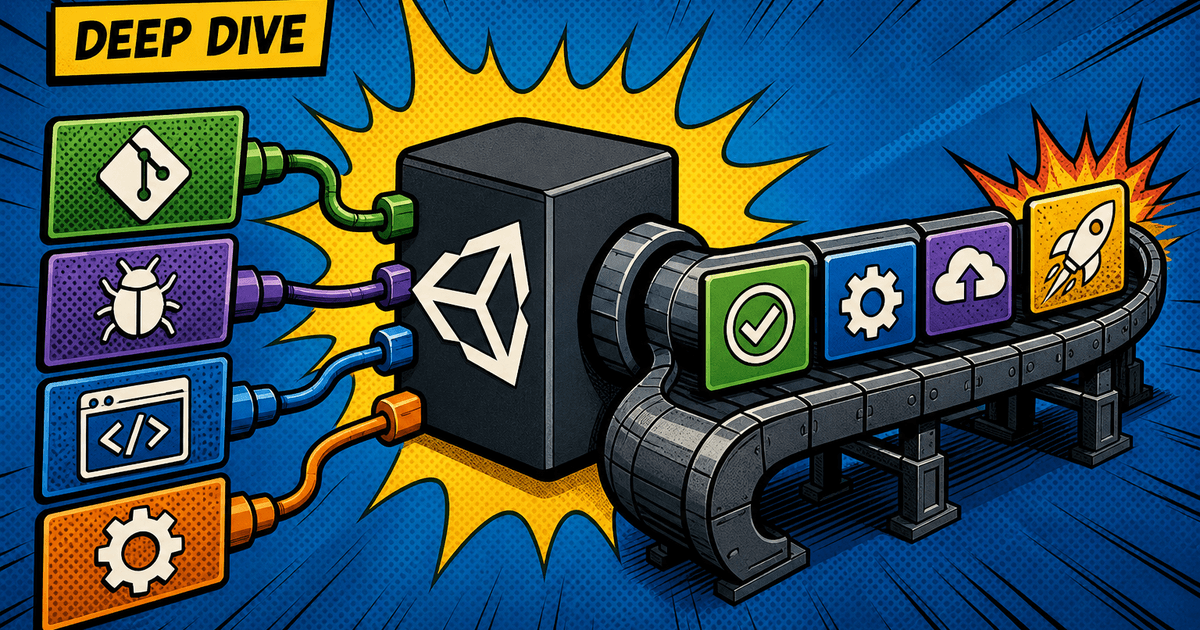
Why Your Dev Tools Aren't Talking to Unity Yet
If you're pulling in a profiler, a version control client, or a custom asset validator and it's sitting next to Unity instead of inside it, you're doing double work every single day. Most teams treat external dev tools as separate applications that happen to point at the same project folder. That's not integration - that's coincidence.
A proper unity dev tools integration guide starts from one assumption: Unity's Editor is a platform, not just an application. It exposes APIs specifically so external tooling can hook into asset import, build pipelines, and window management. If your tools aren't talking to Unity, it's because nobody wired the connection - not because Unity can't support it.
The disconnect usually comes down to three things:
- No shared assembly context between your tool's code and Unity's Editor APIs
- No defined entry point (menu item, window, or callback) for the tool to run from
- No pipeline hook, so the tool runs manually instead of automatically at build time
Fix those three, and you've got integration instead of a folder full of unrelated executables.
Setting Up the Editor Integration Layer: Where the Real Work Happens
The Editor integration layer is the code that lives inside Assets/Editor (or an equivalent Editor-only assembly) and acts as the bridge between your external tool and Unity's internal systems. This is where the real work happens - not in your tool's UI, not in your build server config, but in a set of C# scripts that Unity compiles into Editor-only assemblies.
Start with an assembly definition file (.asmdef) scoped specifically to Editor code. This does two things:
- It prevents your integration code from being compiled into player builds, where it has no business existing.
- It gives you explicit control over which assemblies your integration layer references, so you're not accidentally pulling runtime dependencies into Editor-only logic.
Set the .asmdef's Platforms field to Editor only. Confirm that Include Platforms excludes every runtime target. This single setting prevents an entire category of "why is this shipping in my build" bugs before they happen.
Once the assembly is scoped correctly, your integration layer should expose a clean set of static methods or a singleton-style manager class that external tools can call into via reflection, command-line arguments, or a defined API surface - depending on how your tool communicates with Unity. Don't scatter integration logic across multiple files with unclear ownership. One entry class, clearly named, is easier to debug six months from now than five partial ones.
Package Dependencies and Script References: Getting Your Tools in Scope
Getting your tools "in scope" means Unity's compiler can see them, and your Editor scripts can call them without circular reference errors. This is where most integration attempts stall out.
If your dev tool ships as a Unity Package (via manifest.json or a local package folder), verify the package.json file declares:
- Correct
"unity"version compatibility field - Explicit
"dependencies"for any other packages it needs (Addressables, Timeline, Input System, etc.) - A
"type": "tool"or appropriate classification if you're publishing internally through a private registry
For tools that aren't full packages - internal scripts, vendor SDKs, or DLLs - reference management gets stricter. Every .dll you import needs its Platform Settings checked in the Inspector. If a DLL built for .NET Standard 2.1 gets imported without matching Api Compatibility Level, you'll get silent failures that only show up as missing method exceptions at runtime, not compile time.
A few rules that prevent 90% of scope-related breakage:
- Never mix Editor-only DLLs into a runtime-scoped
.asmdef. Reference them only from your Editor assembly. - Use
asmdefreferences instead of "Any Platform" script folders whenever you have more than two tools interacting. Implicit compilation order is a liability. - Pin package versions in
manifest.jsonrather than trusting "latest." A tool that works today on version 3.2 and silently updates to 4.0 mid-sprint is a support ticket waiting to happen.
If you're still resolving script references by trial-and-error reordering in the compile order settings, you're accumulating technical debt that someone else will pay down during a crunch week.
Editor Windows and Menu Items: Making Tools Accessible Where You Need Them
An integration that requires opening a separate application defeats the purpose. Your tool needs a presence inside the Editor - a menu item, a custom window, or both - so developers reach it without leaving their workflow.
Use [MenuItem("YourTool/Action Name")] attributes to expose entry points directly in Unity's top menu bar. Keep the naming consistent with your tool's actual function; developers scanning a crowded menu bar don't have time to guess what "Process Assets" versus "Run Validation" actually does differently.
For anything beyond a single-action trigger, build a custom EditorWindow. A few non-negotiables when you do:
- Call
GetWindow<T>()with a docked default position so the window doesn't spawn as a floating orphan every time someone opens it. - Implement
OnEnable()andOnDisable()properly to register and unregister any event listeners - leaked delegate references are a common cause of Editor slowdown over time. - Use
EditorGUILayoutgroups intentionally. A window that looks like a debug dump of every field in your tool is a window nobody wants to use twice.
If your tool needs to react to project state - asset selection, scene changes, play mode transitions - hook into EditorApplication.update, Selection.selectionChanged, or EditorSceneManager callbacks rather than polling in a loop. Polling burns CPU cycles for no reason and makes the Editor feel sluggish, which is the fastest way to get your integration uninstalled by a frustrated team.
Automating Build Pipelines Through Dev Tool Hooks
Manual tool invocation is fine for prototyping. It's not fine for production. If your dev tool validates assets, generates code, or bundles content, it needs to run automatically as part of the build - not as a step someone remembers (or forgets) to trigger by hand.
Unity gives you three primary hook points for this:
IPreprocessBuildWithReport- runs before the build starts. Use this for validation: check for missing references, enforce naming conventions, confirm asset import settings match your project's standards.IPostprocessBuildWithReport- runs after the build completes. Use this for packaging steps: signing, compressing output, uploading artifacts to your CI storage.AssetPostprocessorcallbacks (OnPreprocessAsset,OnPostprocessAllAssets) - run during asset import, not build. Use these for tools that need to modify or validate content as it enters the project, not just at build time.
Each of these gives you a callbackOrder property. Set it explicitly. If two tools both hook IPreprocessBuildWithReport without ordering, you get race conditions where validation runs before code generation finishes - and you won't find out until a build fails intermittently on a machine you can't reproduce locally.
For CI environments, expose your integration through -executeMethod command-line invocation so your build server can trigger the same logic that runs locally. Don't build a separate "CI version" of your tool logic. Divergent code paths between local and CI runs are exactly how "works on my machine" bugs survive into production.
A ten-minute setup validating your hook order today prevents a four-hour debugging session next sprint when two tools silently step on each other mid-build.
Debugging Tool Integration: Finding Where the Handoff Fails
When integrated tools break, they rarely fail loudly. They fail quietly - a callback that doesn't fire, a reference that resolves to null, a build that "succeeds" but skips your validation step entirely. Debugging integration means finding the handoff point, not the symptom.
Work through these in order:
- Confirm the entry point actually fires. Add a
Debug.Logat the very top of your MenuItem method, window'sOnEnable, or build hook. If it doesn't print, the problem is registration, not logic. - Check assembly compilation order. Open the Console and filter for compilation warnings. A silently failed compile in a dependency assembly will prevent your integration script from loading at all, with no obvious error pointing to the cause.
- Verify callback order conflicts. If you're using build hooks, temporarily set your tool's
callbackOrderto an extreme value (very low or very high) to isolate whether another tool's hook is interfering. - Inspect serialized references. A
MonoBehaviourorScriptableObjectfield that shows "Missing (Script)" in the Inspector means Unity lost the GUID mapping - usually from a script being moved or renamed without updating meta files. - Check Player Settings scripting define symbols. Integration code gated behind
#if UNITY_EDITORor a custom define symbol will silently no-op if that symbol isn't set for the current build target.
Don't guess at the failure point. Instrument the handoff explicitly, confirm each link in the chain, and you'll find the break in minutes instead of hours.
Shipping Integrated Tools Without Bloating Your Runtime
Every integration you build has to answer one question before it ships: does any of this code end up in the player build? If the answer is yes for anything beyond intentional runtime features, you've got a problem.
Confirm your Editor-only code never leaks into runtime assemblies:
- Double-check every
.asmdeffor your integration layer has Platforms restricted to Editor. - Search your project for any
#if UNITY_EDITORblocks inside runtime scripts and confirm they're only wrapping code that should genuinely be stripped from the player. - Check Managed Stripping Level in Player Settings. Set it to Medium or High for release builds, and verify your tool's runtime-facing components (if any) survive stripping - test this explicitly rather than assuming.
If your dev tool needs a small runtime component (a debug overlay, a telemetry hook), isolate it into its own assembly separate from the Editor integration layer, and gate its inclusion behind a scripting define symbol you control per build configuration. Ship it in development builds, strip it from release builds, and never let the two blur together.
A dev tools integration that respects this boundary gives your team faster workflows in the Editor without adding a single byte of unnecessary weight to what players actually download. That's the difference between tooling that helps you ship and tooling that quietly becomes part of the problem.
Related Reading
Article complete
XP lands automatically when you reach the end.
Rate this article
Comments
Comments are held for moderation before appearing publicly.