
Why Choosing the Right Unity Dev Tools Matters in 2026
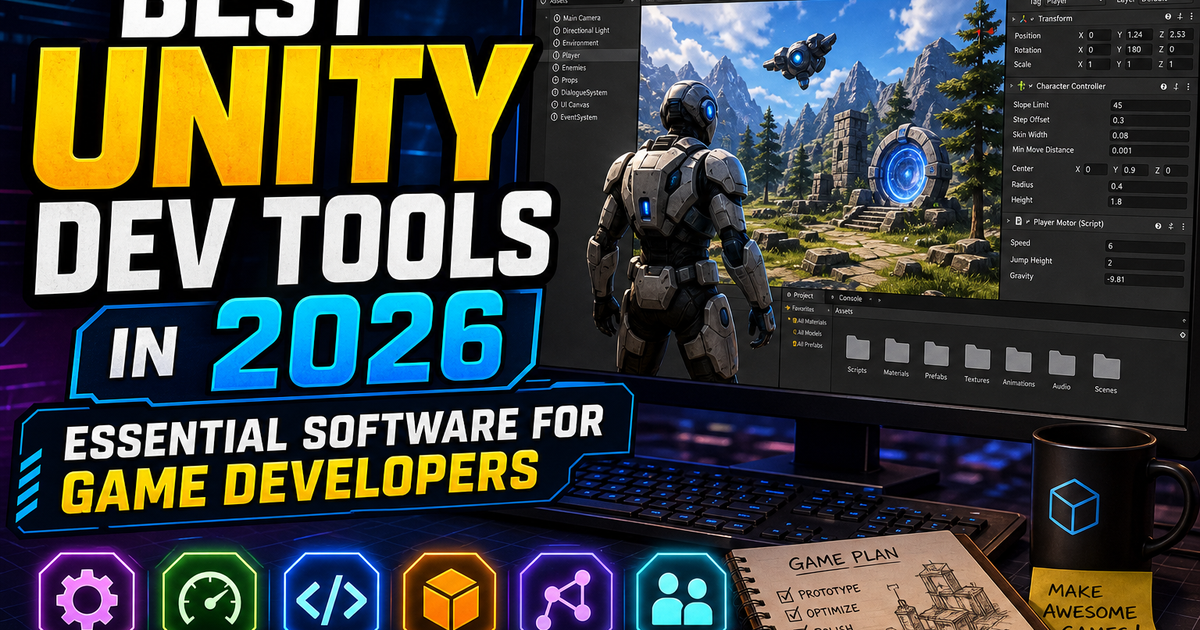
Unity’s ecosystem has grown dense enough that picking the wrong tools costs you weeks, not hours. Build times balloon, memory leaks slip past QA, and cross-team collaboration turns into a merge-conflict nightmare when your stack isn’t aligned with how modern Unity projects actually get built. That’s why identifying the best unity dev tools in 2026 isn’t a nice-to-have research task — it’s a production requirement.
The engine itself has shifted significantly with the DOTS/ECS maturity curve, expanded render pipeline options, and tighter integration with cloud build infrastructure. Tools that worked fine for a 2021-era Unity project may actively hurt you now. Profilers need to understand Burst-compiled jobs. Version control needs to handle massive binary assets without choking. AI copilots need context windows large enough to reason about entire C# codebases, not just autocomplete a single method.
This guide breaks down the categories that matter most — IDEs, profilers, asset pipelines, AI tooling, collaboration platforms, and the emerging tools worth watching — with concrete recommendations based on what’s actually shipping in production studios right now.
Top Integrated Development Environments and Code Editors
Your IDE is where you spend most of your working hours, so marginal improvements compound fast.
JetBrains Rider remains the top pick for serious Unity development in 2026. Its Unity-specific inspections catch issues like incorrect coroutine usage, missing null checks on serialized fields, and inefficient LINQ calls inside Update() before you even hit play. The dotTrace and dotMemory integrations are baked directly into the editor, so profiling doesn’t require context-switching to a separate application. Rider’s refactoring engine also handles large-scale C# reorganization — renaming a MonoBehaviour across 400 scripts and scene references — with far fewer broken links than Visual Studio.
Visual Studio 2026 still has a place, particularly for teams already embedded in the Microsoft toolchain or using Visual Studio for native plugin development alongside C++/C# interop. The Unity Tools extension has improved scene-reference navigation, but it still lags behind Rider on raw refactoring speed and memory diagnostics.
Visual Studio Code continues to dominate among indie developers and smaller teams, largely because of its speed and the maturity of the C# Dev Kit. Combined with the Unity extension and IntelliCode suggestions, VS Code now offers a genuinely competitive lightweight alternative — especially for developers who bounce between Unity, web tooling, and shader work in the same session.
For shader-heavy pipelines, Shader Graph debugging support in both Rider and VS Code has closed a long-standing gap: you can now step through node graphs and inspect intermediate values without exporting to an external shader debugger.
The real decision point in 2026 isn’t “which editor is best” in the abstract — it’s which one integrates cleanest with your profiling and build tools, because IDE lock-in downstream affects your entire pipeline.
Performance Profiling and Debugging Tools
Performance issues in Unity rarely announce themselves clearly. A frame spike might be garbage collection, a physics query, or a poorly batched draw call — and guessing wrong wastes days.
Unity Profiler itself has become significantly more capable, with the Profile Analyzer package now supporting automated regression detection across CI builds. If a commit adds 2ms to your average frame time, the profiler flags it in the build report before it reaches a human tester. The GPU-side profiling module also now supports mobile tile-based renderers more accurately, which matters if you’re shipping to a broad Android device spread.
dotMemory and dotTrace from JetBrains remain the standard for deep memory and CPU analysis outside the Unity Editor’s built-in tools. They’re particularly good at catching managed memory leaks caused by event subscriptions that never get unsubscribed — a classic Unity bug that the native profiler often misses until it’s already caused a crash on low-end devices.
Superluminal Perf has picked up serious traction in 2026 for CPU-bound native and Burst-compiled code. If your project leans heavily on DOTS/ECS, Superluminal gives you a timeline view that’s far more granular than Unity’s own Burst inspector, letting you see exactly which job system chunk is stalling the main thread.
For mobile-specific debugging, Unity’s Adaptive Performance package combined with device-vendor tools (Snapdragon Profiler, Arm Streamline) is still the correct approach — no cross-platform tool fully replaces vendor-specific thermal and power draw diagnostics.
A practical rule: don’t rely on a single profiler. Use the Unity Profiler for quick frame-by-frame triage, then escalate to dotTrace or Superluminal only when you’ve isolated a specific subsystem worth deep investigation. Jumping straight into a heavyweight profiler on an unoptimized scene just produces noise.
Asset Management and Version Control Solutions
Unity projects generate enormous binary assets — textures, meshes, audio, baked lighting data — and standard Git handles this poorly by default.
Git with Git LFS is still the baseline for small teams, but by 2026 most studios past a certain size have moved to Plastic SCM (now Unity Version Control), which is purpose-built for Unity’s asset structure. Its branch-and-merge model handles scene and prefab merging with a visual diff tool that actually understands GameObject hierarchies, rather than treating .unity files as opaque YAML blobs. For teams with artists committing large binary files daily, this alone eliminates a huge share of merge conflicts.
Perforce Helix Core remains dominant in AAA studios, especially those with existing pipelines from other engines. Its locking model prevents two artists from simultaneously editing the same binary asset — something Git-based workflows still struggle to enforce cleanly without discipline.
On the asset organization side, Addressables is no longer optional for anything beyond a small prototype. Combined with Unity Cloud Content Delivery, it’s the standard way to manage remote asset bundles, patch content post-launch, and keep initial build sizes down for mobile storefronts with strict size caps.
For teams managing large art libraries, Unity Asset Manager — Unity’s own cloud-based DAM integrated with the Editor — has matured into a legitimate alternative to third-party digital asset management tools. It handles versioning of source art files (PSD, FBX, Substance) alongside the in-engine assets they generate, which used to require a separate DAM subscription entirely.
The takeaway: pick version control based on your binary asset volume, not your comfort with a particular tool. A five-person prototype team can survive on Git LFS. A forty-person production studio cannot.
AI-Assisted Development and Automation Tools
AI tooling in Unity development has moved well past autocomplete gimmicks. In 2026, the useful tools are the ones with real codebase context and Unity-specific training.
GitHub Copilot with Unity-aware context (via the C# Dev Kit integration) now understands MonoBehaviour lifecycle methods, common component patterns, and can generate reasonable ScriptableObject architectures from a plain-language description. It’s still not a replacement for architectural judgment, but for boilerplate — input handling, state machines, object pooling — it saves real time.
Unity Muse has expanded past its initial texture and sprite generation roots into behavior scripting assistance and scene population tools. Muse Chat, now embedded contextually in the Editor, can answer questions about your specific project’s API usage rather than generic Unity documentation, because it indexes your actual codebase and asset references.
JetBrains AI Assistant inside Rider handles a different niche: it’s tuned for refactoring suggestions and catching subtle bugs — race conditions in coroutines, incorrect async/await usage in Unity’s main-thread-restricted APIs — rather than generating new features wholesale.
Automation tools worth flagging: Unity Test Runner combined with AI-generated test scaffolding has cut the time to build reasonable unit test coverage for gameplay logic significantly. You still need to write meaningful assertions yourself, but generating the boilerplate test structure for a new class is now close to instant.
The honest caveat here: AI-generated code in Unity projects still needs the same code review rigor as human-written code. Hallucinated API calls against older Unity versions remain a real problem, especially when documentation for deprecated APIs still floats around training data.
Collaboration and Build Pipeline Tools
Shipping a Unity game in 2026 means coordinating build automation, QA distribution, and live-ops updates without a dedicated DevOps team in most indie and mid-size studios.
Unity Cloud Build remains the most straightforward option for teams wanting build automation without standing up their own infrastructure. It’s tightly integrated with Unity Version Control and Addressables, and its 2026 iteration finally supports parallel platform builds efficiently enough to cut multi-platform CI time roughly in half compared to sequential builds.
Jenkins and GitHub Actions with custom Unity build scripts still dominate at larger studios that want full control over their pipeline, particularly when builds need to integrate with proprietary QA tooling or platform certification workflows (console cert requirements especially).
For QA distribution, Unity Gaming Services’ build distribution combined with tools like Diawi or TestFlight (iOS) covers most mobile testing needs. On the console side, dev kit distribution still runs through platform-specific portals, which no third-party tool fully abstracts away.
Perforce Helix Swarm and Plastic SCM’s built-in code review tools have both improved their integration with Slack and Discord notifications, which matters more than it sounds — build failures and merge conflicts that sit unnoticed for a day cost real production time on tight sprint cycles.
Communication-wise, Discord with custom bot integrations for build status, crash reports, and analytics alerts has become the de facto standard for small-to-mid studios, largely replacing dedicated project management dashboards for day-to-day dev chatter, while tools like Jira and Linear still handle the structured backlog and sprint tracking side.
Emerging Tools Reshaping Unity Workflows
A few tools are still early but worth tracking closely heading further into 2026.
Unity Sentis, the engine’s runtime neural network inference package, is starting to show up in shipped titles for on-device AI behavior — adaptive enemy tactics, procedural dialogue selection — without server round-trips. It’s not mainstream yet, but the tooling around model conversion and quantization has improved enough that mid-size teams are experimenting seriously.
Runtime-editable ECS inspectors built by community developers on top of Unity’s Entities package are filling a gap Unity’s own tooling hasn’t fully closed — live-editing entity component data during play mode with the same fluidity as GameObject inspection.
Cloud-based collaborative scene editing, similar in spirit to Figma’s multiplayer model, is being piloted by a handful of Unity-adjacent startups. Multiple developers editing the same scene simultaneously, with conflict resolution happening at the field level rather than the file level, would eliminate a huge category of merge pain if it matures.
Finally, keep an eye on procedural content tooling built around AI diffusion models integrated directly into Unity’s terrain and level design workflows. Early versions are rough, but the trajectory suggests meaningful production use within the next release cycle or two.
None of these are must-haves today, but studios that ignore emerging tooling entirely tend to find